Geographic Targeting for a Real Estate Brokerage
A brokerage was spending heavily on direct mail with poor results. We built a heat map that identifies which properties are most likely to list soon, so they could focus their outreach where it mattered.
The brokerage was mailing postcards to entire zip codes — spending over $15K a month with a 0.3% response rate. They had a sense that some neighborhoods turned over faster than others, but no data to act on it. Meanwhile, competitors were picking up listings in areas they weren't even targeting.
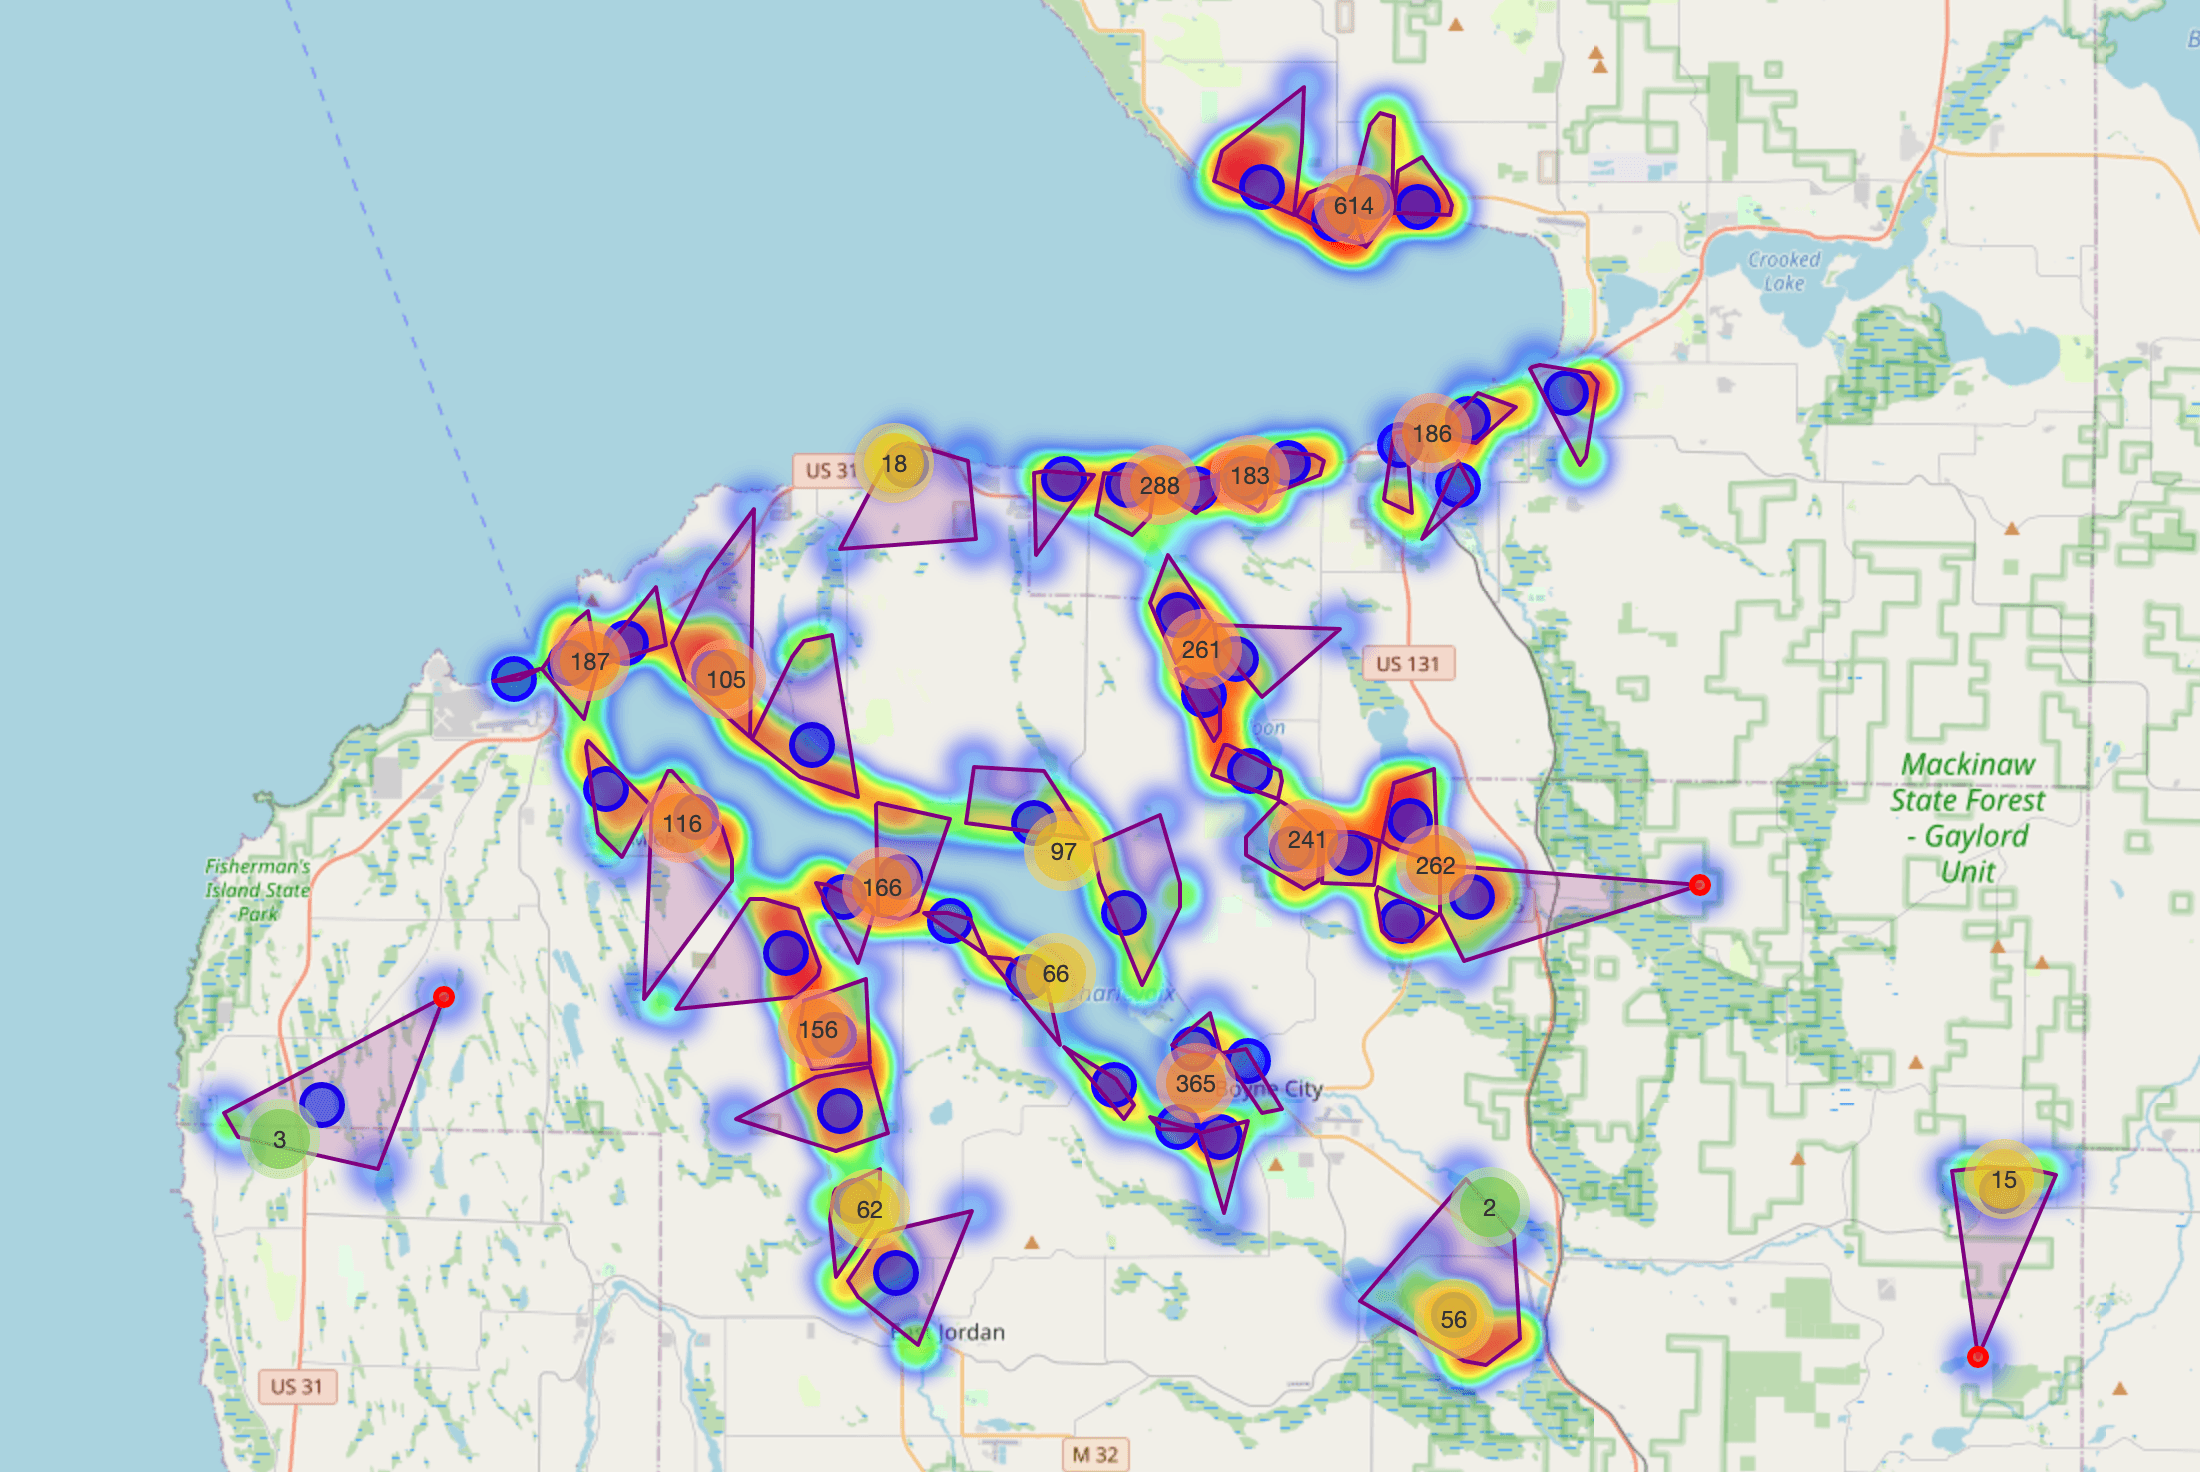
We pulled together public records, MLS data, and demographic signals into a model that scores properties by likelihood to list in the next 6-12 months. The results are shown on a heat map so the team can see opportunity block by block. We also built a pipeline to generate personalized mail copy for each household.
Response rates went from 0.3% to over 1%. They cut direct mail volume by 60% and still got more leads. In Q1 they closed 8 additional listings directly tied to the targeted campaign.
What happened
- ·Response rate went from 0.3% to over 1%
- ·Direct mail spend cut by 60%
- ·8 additional listings closed in Q1
- ·Block-by-block visibility into listing probability
Working on something similar?
We'd be happy to talk through your situation and see if we can help.
Get in touch